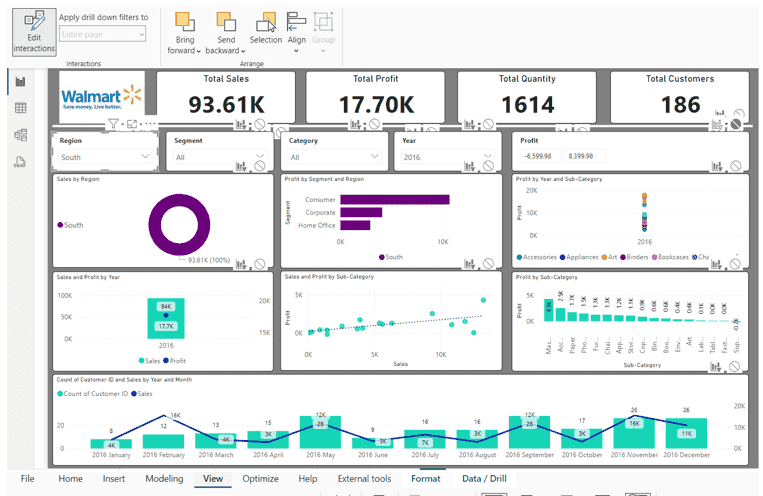
Microsoft Power BI is a powerful business intelligence tool that allows users to visualize and analyze data interactively. Among its many features, slicers stand out as a key element for data filtering and interaction. In this blog, we’ll explore what slicers are, their main purpose, and how they enhance the functionality of Power BI reports.
If you’re looking to deepen your understanding of Power BI and explore career opportunities, this guide will also highlight how you can learn Power BI effectively and even pursue a Microsoft Power BI certification to validate your skills.
What Are Slicers in Microsoft Power BI?
Slicers in Microsoft Power BI are visual filters that allow users to interact with data dynamically. Represented as buttons, drop-down menus, or tiles, slicers enable viewers to focus on specific data points by filtering a dataset based on selected criteria. Unlike conventional filters, slicers provide a user-friendly, visual interface that is easy to use even for non-technical users.
The Main Purpose of a Slicer in Microsoft Power BI
The primary purpose of a slicer in Microsoft Power BI is to enhance data exploration and interactivity within reports. Here’s how slicers fulfill this role:
Dynamic Filtering:
Slicers allow users to refine large datasets by selecting specific values, such as categories, dates, or regions, without the need to modify the underlying data model.
Improved User Experience:
They provide a more intuitive way for users to interact with data compared to standard dropdown filters or text inputs.
Contextual Analysis:
Slicers help narrow down data to a particular segment, enabling users to conduct focused analysis and derive actionable insights.
Enhanced Visual Interaction:
Slicers dynamically update all linked visuals on the report page, ensuring that charts, tables, and graphs display the filtered data context in real-time.
Simplified Data Comparison:
With slicers, comparing data across different categories or time periods becomes straightforward and efficient.
Types of Slicers in Microsoft Power BI
Microsoft Power BI offers several types of slicers to cater to different needs:
Text Slicers: Used for filtering based on text-based categories.
Numeric Range Slicers: Allow filtering within a specific range of numbers.
Date Slicers: Enable filtering data by date or time ranges, often used for time-series analysis.
Hierarchical Slicers: Allow users to filter data by hierarchical fields, such as Country → State → City.
Key Benefits of Using Slicers
Interactive Reports:
Slicers make reports more engaging by letting users interact with data directly.
Self-Service Analytics:
Business users can independently explore data without needing technical assistance or altering report layouts.
Customizable Options:
Power BI slicers can be styled and formatted to match report themes, ensuring a seamless visual experience.
Flexibility and Efficiency:
Slicers work across multiple visuals, saving time when analyzing interconnected datasets.
How to Add and Use a Slicer in Microsoft Power BI
Adding a slicer to your Power BI report is straightforward:
Insert a Slicer:
Select the Slicer visualization from the Visualizations pane.
Drag a field from the Fields pane into the slicer visual.
Customize the Slicer:
Adjust the slicer format, such as switching between a list or a dropdown.
Apply filters to include or exclude specific values.

Interactivity:
Select values on the slicer to filter data across all connected visuals in the report.
Linking Slicers:
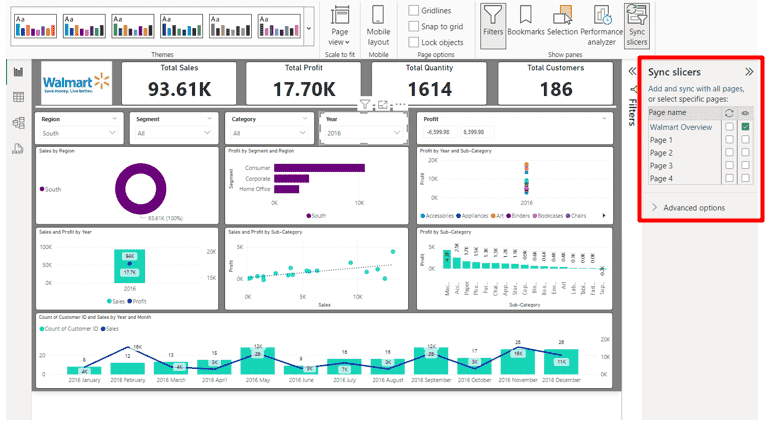
Use Sync Slicers to apply the same filter across multiple report pages.

Best Practices for Using Slicers
Keep It Simple: Avoid overloading your report with too many slicers; prioritize those most relevant to the analysis.
Use Hierarchies Wisely: Combine hierarchical slicers for intuitive data exploration.
Consistent Design: Align slicer styles with the overall report theme for a professional look.
Test Interactions: Ensure slicers update visuals accurately to maintain data integrity.
Why Learn Power BI and Get Certified?
Becoming proficient in Microsoft Power BI is essential for anyone pursuing a career in data analysis or business intelligence. Learning how to use slicers effectively is just one aspect of mastering Power BI. To take your skills to the next level, consider enrolling in a Microsoft Power BI certification course.
Benefits of Power BI Certification:
Validate your expertise in creating dynamic reports and dashboards.
Enhance your resume and career prospects in data-driven roles.
Gain hands-on experience with real-world business scenarios.
By choosing to learn Power BI through structured courses, you’ll gain the knowledge and confidence to excel in the industry.
Conclusion
Slicers in Microsoft Power BI are more than just filters—they are tools that empower users to explore and interact with data effortlessly. By providing dynamic filtering and enhancing the user experience, slicers play a pivotal role in creating impactful, interactive reports.
Whether you’re analyzing sales performance, tracking marketing campaigns, or monitoring operational metrics, leveraging slicers effectively will elevate your data storytelling and decision-making capabilities.
Ready to elevate your Power BI skills? Learn Power BI today and explore certification opportunities to unlock your full potential!
